
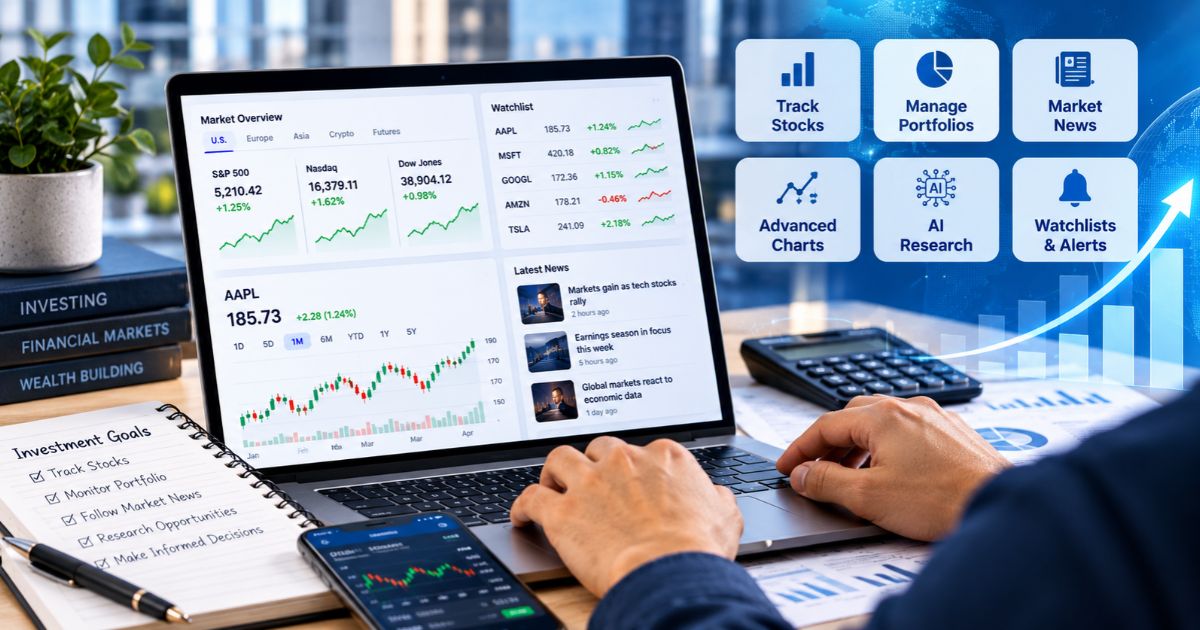
Google Finance has evolved from a simple market-data page into a broader research platform for tracking securities, following market news, building watchlists, creating portfolios, analyzing charts, and exploring AI-assisted financial research.
The current experience can help investors and students monitor stocks, currencies, crypto, futures, market indices, earnings activity, and company information from one interface. However, it should be treated as a research and monitoring tool rather than a brokerage account or a source of personalized investment advice.
This guide explains nine useful features, including watchlists, portfolios, advanced charts, AI research, earnings tools, market news, scheduled tasks, the Android app, and the separate GOOGLEFINANCE function available inside Google Sheets.
If you are still building your investing and financial-literacy foundation, start with our personal finance complete guide and personal finance books guide.
Important: Market information and AI-generated insights are provided for informational purposes. They should not be treated as personalized investment, tax, financial, or legal advice.
Key Takeaways
- The platform provides market information for stocks, currencies, crypto, futures, indices, and other securities.
- Custom lists and watchlists make it easier to organize securities you want to follow.
- Portfolio tools can track holdings and provide allocation, concentration, and performance insights.
- Current AI research features can summarize market developments and support follow-up research questions.
- Charts now include comparison tools, indicators, and key-event analysis.
- Earnings tools can provide calls, transcripts, financial reports, and related company information.
- Scheduled research tasks can deliver recurring market updates.
- An Android mobile app is available, while some advanced features remain web-only.
- The GOOGLEFINANCE function in Sheets is useful for custom spreadsheets but has important market, delay, and data-access limitations.
1. What Is Google Finance?
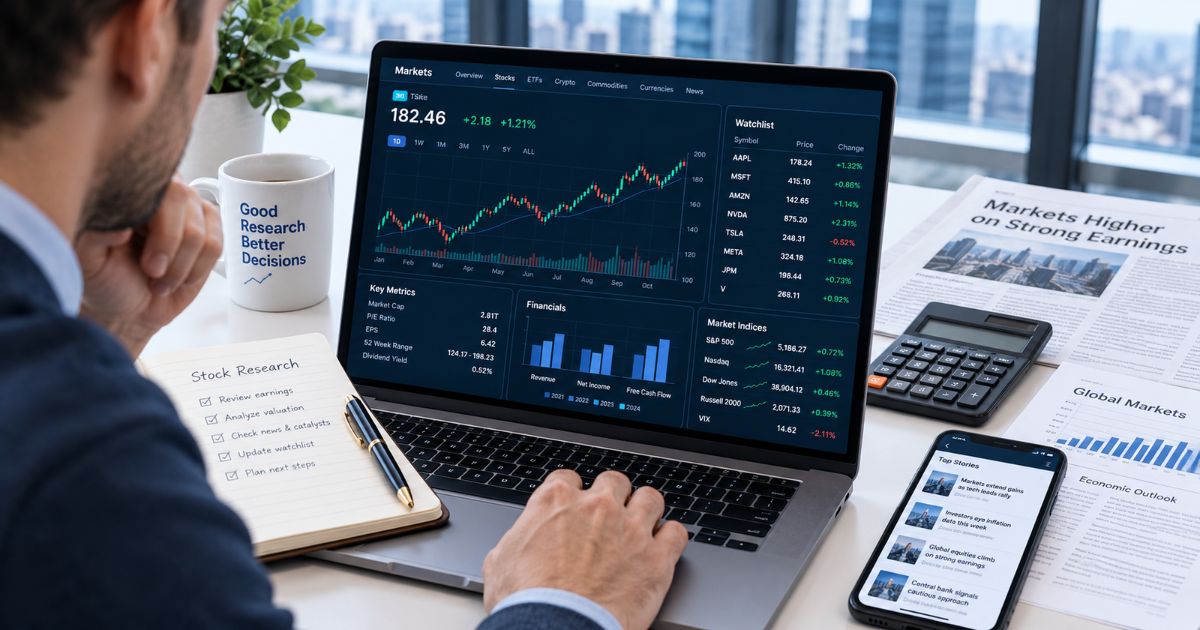
Google Finance is Google’s financial-market research experience for monitoring securities, market movements, company data, news, and investment-related information.
The current platform includes market sections for areas such as:
- U.S. markets;
- European markets;
- Asian markets;
- Latin American markets;
- currencies;
- cryptocurrencies;
- futures; and
- major equity sectors.
Users can also search individual securities and review market information connected with them.
Open the official Google financial-market platform.
Do you need a Google Account?
Not for every feature.
Google states that some functions are available without signing in. A Google Account is required for features such as custom watchlists, deeper financial insights, and the full AI research experience.
This corrects the older claim that users must always sign in simply to explore the service.
For broader financial research habits, see our financial success strategies.
2. Create Watchlists and Follow Securities
A Google Finance watchlist can help you organize securities without maintaining a full investment portfolio.
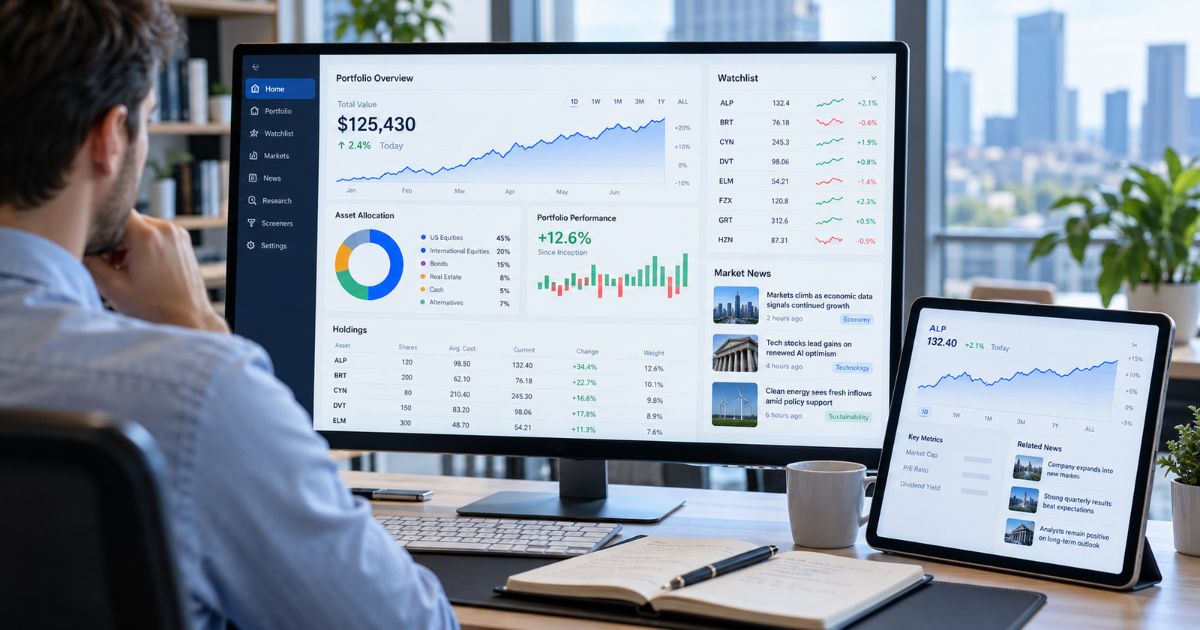
Google’s current help documentation allows users to follow securities and place them into custom lists.
Read Google’s official guide to following and comparing securities.
What can a watchlist help you do?
A watchlist can be useful for monitoring:
- stocks you own;
- companies you are researching;
- market indices;
- potential investment ideas;
- competitors;
- sector leaders;
- currencies; and
- other supported securities.
Watchlist-related news
Google also surfaces market news related to securities in your watchlists.
This can help reduce the need to search separately for every company, although users should still check the original source before relying on a headline or summary.
If you are learning how to interpret financial information rather than simply following prices, our personal finance course guide provides additional background.
3. Use the Google Finance Portfolio Tools
A Google Finance portfolio goes beyond a simple list by allowing you to track investments and portfolio-level information.
The current web experience allows users to create portfolios manually, through the AI research panel, or by uploading certain portfolio information.
Portfolio insights
Current portfolio tools can provide information involving:
- asset allocation;
- sector exposure;
- index exposure;
- concentration risk;
- performance heatmaps; and
- investments contributing to gains or losses.
These tools can make portfolio structure easier to understand visually.
Uploading portfolio information
The current interface can also create a portfolio from an uploaded image or spreadsheet containing investment information.
Google states that uploaded files used for this portfolio workflow are not retained by the service and that users retain control over their portfolio data.
Users should still avoid uploading unnecessary sensitive financial information and should review Google’s current privacy guidance before using any account-connected service.
Portfolio tracking is not portfolio advice
A portfolio dashboard may reveal concentration or allocation patterns, but it does not determine whether an investment is suitable for you.
Investment decisions can depend on:
- risk tolerance;
- time horizon;
- income;
- liquidity needs;
- tax situation;
- debt;
- financial goals; and
- other personal circumstances.
For more general planning principles, see our top financial tips and personal finance lab guide.
4. Analyze Stocks With Advanced Charts
Google Finance charts now provide more than basic historical price visualization.

Current chart tools include options to:
- change chart styles;
- compare securities;
- use indicators;
- review historical price movements; and
- identify important market moments.
Google’s “Key moments” feature is designed to highlight unusual price changes, volume movements, or related market events.
Review Google’s current Finance feature documentation.
Compare securities
Comparing multiple assets on the same chart can help place a company’s performance in context.
For example, you might compare:
- a stock with a market index;
- two competitors;
- a company with its sector;
- two ETFs; or
- different securities over the same period.
Historical performance is not a forecast
Charts are useful for understanding what happened in the past, but historical price movements do not guarantee future returns.
Users should combine chart information with company fundamentals, risk, valuation, financial statements, and other relevant research.
Students interested in careers that involve this type of analysis can also read our finance degree career guide.
5. Explore Google Finance AI Research
Google Finance AI is one of the biggest differences between the current platform and its older versions.
The Research panel allows users to ask financial-market questions and explore market developments through an AI-assisted interface.
Dive deeper with AI
Google currently allows users to open a research panel from market stories and ask follow-up questions about topics such as:
- market movements;
- company developments;
- economic events;
- industry changes;
- international developments; and
- historical financial trends.
Deep Search
The current Research panel also includes a deeper research option designed to produce more detailed reports on financial topics.
Bullish and bearish perspectives
When viewing certain securities, the platform can organize information around bullish and bearish viewpoints gathered from financial sources.
This can help users identify competing arguments rather than seeing only one interpretation of a company or market event.
AI can make mistakes
Google explicitly warns that AI-generated financial summaries, insights, and visualizations can contain errors.
Users should independently verify:
- prices;
- earnings information;
- financial ratios;
- company filings;
- news claims; and
- other material facts.
AI-generated information should not be treated as a recommendation to buy, sell, or hold an investment.
For a broader framework for evaluating financial claims, our personal finance guide covers research and decision-making principles.
6. Track Earnings Calls and Financial Reports
The current platform includes considerably deeper company-earnings tools than the old version of this article described.
Upcoming earnings
Users can monitor upcoming earnings events from the homepage and receive contextual information for followed securities.
Live and recorded earnings calls
The web experience can provide:
- live earnings-call streams;
- replays of earlier calls;
- playback navigation;
- transcript highlights;
- full transcripts;
- AI-generated summaries;
- official filings; and
- historical earnings comparisons.
This makes the platform potentially useful for researching what management is saying alongside reported financial results.
Use official documents for verification
When a financial decision depends on a company’s earnings, revenue, risk factors, or other material information, official filings should generally take priority over a third-party summary.
The platform itself provides access to official documents for supported companies.
Students and professionals interested in interpreting company finances may also find our business finance guide useful.
7. Follow Market News and Explore Multiple Asset Types
The current service provides market news and updates connected with user interests and followed securities.
The homepage also organizes market information across categories such as:
- U.S. equities;
- international markets;
- currencies;
- crypto;
- futures;
- market sectors;
- most-active securities;
- daily gainers; and
- daily losers.
Market news should provide context, not trigger impulsive decisions
Fast-moving headlines can create emotional reactions.
Before acting on market news:
- open the original article;
- check the publication date;
- identify the original source;
- verify company filings where relevant;
- separate facts from commentary; and
- consider your own investment horizon.
Our financial success guide explains why financial decisions should be connected with longer-term goals rather than short-term noise.
8. Use Scheduled Research Tasks and the Mobile App
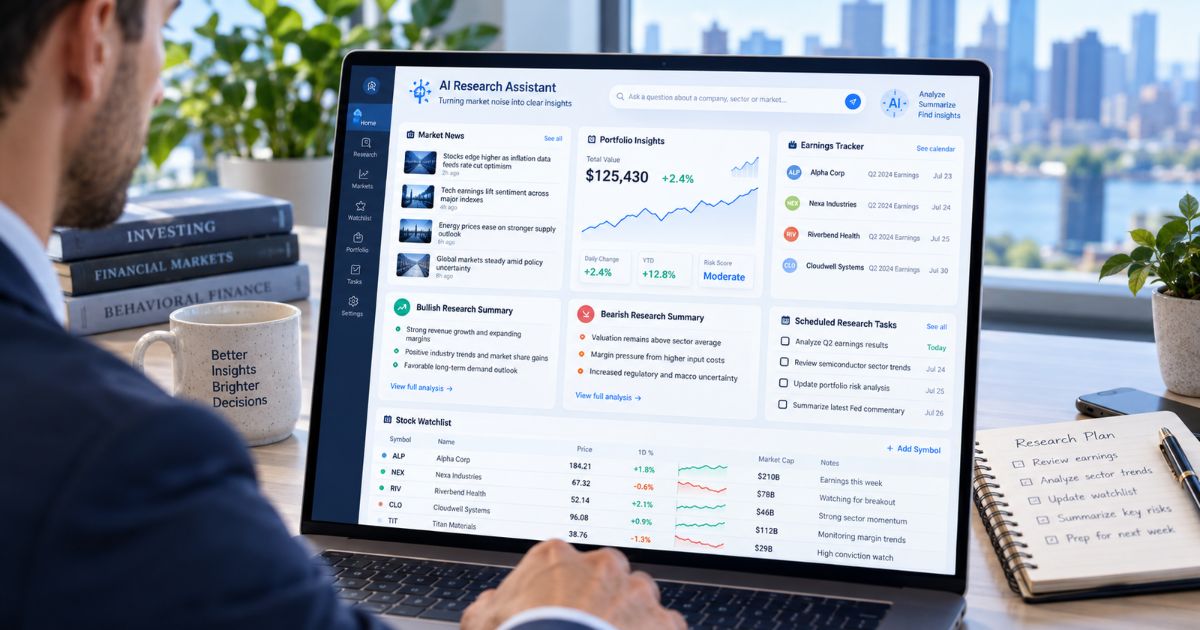
The current web experience can create scheduled research tasks for recurring market updates.
Scheduled tasks
Examples published by Google include prompts similar to:
- providing recurring crypto updates;
- tracking new IPO developments; and
- monitoring financial topics on a chosen schedule.
Notifications can then surface when the requested update is ready.
Google Finance app
A dedicated Android app is currently available.
The mobile experience includes:
- the core research panel;
- interactive charts;
- market news; and
- custom watchlists.
At the time of this update, Google states that features such as portfolios, agentic tasks, and live earnings-call streaming remain web-only and are expected to reach mobile later.
Google also states that iOS support is coming, so readers should check the current official documentation rather than assuming platform availability remains unchanged.
Feature availability can change
This is especially important for a technology product. Features, regions, app support, AI capabilities, and data sources can change after this article is published.
Always check Google’s latest support documentation for current availability.
If you regularly use technology for financial organization, our personal finance tools guide provides additional ideas.
9. Use the GOOGLEFINANCE Function in Google Sheets
The GOOGLEFINANCE function is related to the financial data service but works inside Google Sheets.
It can retrieve current or historical securities information into spreadsheet cells.
Read the official GOOGLEFINANCE function documentation.
Basic syntax
The official syntax is:
=GOOGLEFINANCE(ticker, [attribute], [start_date], [end_date|num_days], [interval])Example: current price
=GOOGLEFINANCE("NASDAQ:GOOG","price")Example: historical prices
=GOOGLEFINANCE("NASDAQ:GOOG","price",TODAY()-30,TODAY())Data attributes
Supported attributes can include:
- price;
- opening price;
- daily high;
- daily low;
- volume;
- market capitalization;
- P/E ratio;
- EPS;
- 52-week high;
- 52-week low;
- beta;
- percentage change; and
- currency.
Some attributes are not available for every security.
Use exchange-qualified tickers
Google recommends including both the exchange and ticker symbol to reduce ambiguity.
For example:
NASDAQ:GOOGis preferable to simply:
GOOGImportant GOOGLEFINANCE Limitations
The Sheets function should not be described as a professional real-time market feed.
Quotes may be delayed
Google’s official documentation states that quotes are not sourced from every market and may be delayed by up to 20 minutes.
This makes the function more appropriate for research, tracking, education, and spreadsheet analysis than for execution-sensitive trading decisions.
International-market support is limited
The function documentation states that most international exchanges are not supported.
Historical data has API restrictions
Historical financial data returned by the Sheets function cannot currently be downloaded or accessed through the Sheets API or Apps Script in the normal way.
Mutual-fund attributes are limited
Google’s documentation states that mutual-fund attributes are currently not supported in Sheets.
The function is currently English-only
The official documentation also identifies the spreadsheet function as English-only.
These restrictions are important if you plan to build a large automated portfolio tracker around Sheets.
Google Finance vs GOOGLEFINANCE in Sheets
| Feature | Web / App Experience | Google Sheets Function |
|---|---|---|
| Main purpose | Market research and monitoring | Spreadsheet data retrieval |
| Watchlists | Yes | Build manually in Sheets |
| Portfolios | Available on web | Custom spreadsheet approach |
| AI research | Available in current experience | No equivalent built into the function |
| Advanced charts | Built into the research interface | Can build custom Sheets charts |
| Historical prices | Visual charting | Supported for selected data |
| Trading | No brokerage execution | No brokerage execution |
Google Finance vs Other Financial Platforms
No single platform is automatically best for every user.
Google Finance vs Yahoo Finance
Both can be used for market research, stock information, news, charts, and investment monitoring.
The better option depends on the exact data, analytics, news sources, portfolio tools, and interface you prefer.
Google Finance vs TradingView
TradingView is commonly used by people who want extensive charting, technical indicators, community features, and trader-oriented tools.
Google’s platform is more closely integrated with Google Search and its AI research experience.
Google Finance vs Bloomberg
Bloomberg’s professional products serve much more advanced institutional, market-data, and professional workflows.
Comparing a free consumer research platform directly with a professional terminal is therefore not a like-for-like comparison.
Google Finance vs MSN Finance
Both provide consumer-oriented market information and financial news.
You can compare the approaches in our MSN Finance stock guide.
What Google Finance Should Not Be Used For
It is not a brokerage account
You cannot treat the service as a replacement for the brokerage account used to place and settle securities trades.
It is not personalized investment advice
Google explicitly states that its financial information and AI insights are not personalized financial, investment, tax, or legal advice.
It is not guaranteed error-free
Market-data errors, third-party-source issues, AI mistakes, and delays can occur.
It should not replace official filings
For material company research, verify important information through:
- regulatory filings;
- company investor-relations pages;
- official earnings documents;
- regulatory agencies; and
- reputable primary sources.
Our financial decision-making guide also explains why important decisions should be based on reliable information rather than a single dashboard.
Who May Find the Platform Useful?
Beginning investors
Beginners can use it to learn how market prices, indices, company news, charts, and watchlists work.
Long-term investors
Watchlists, portfolio views, earnings information, and company research can support ongoing monitoring.
Students
Finance and business students can explore securities, financial reports, price histories, and company developments.
If finance is a possible career path, see our finance degree careers guide.
Business owners
Business owners may use market information to observe sectors, currencies, economic developments, and publicly traded competitors.
Our marketing and finance guide explains how external market information can support business planning.
Tips for Using Financial Market Tools Responsibly
- Create focused watchlists instead of following hundreds of unrelated securities.
- Verify material figures before acting on them.
- Use charts for context, not prediction certainty.
- Read original news sources rather than headlines alone.
- Check official company filings for important earnings information.
- Do not treat AI-generated summaries as professional advice.
- Understand whether displayed prices are delayed.
- Separate portfolio tracking from portfolio suitability.
- Avoid making emotional trades based on one market headline.
- Review the source and date of financial information.
For broader money-management discipline, see our complete personal finance guide.
Frequently Asked Questions
What is Google Finance?
Google Finance is Google’s market-research experience for exploring securities, financial markets, news, charts, portfolios, watchlists, earnings information, and AI-assisted research.
Is Google Finance free?
The consumer experience is accessible without a traditional paid market-data subscription. Some features require signing in with a Google Account. Availability can also vary by region and device.
Do I need a Google Account?
Some features can be used without signing in. Custom watchlists, deeper financial insights, and full AI research features require a Google Account according to Google’s current documentation.
Can I create a portfolio?
Yes. The current web experience supports custom portfolios and portfolio insights involving allocation, concentration, and performance.
Does Google Finance have AI?
Yes. The current platform includes an AI-powered Research panel, market insights, deeper research, AI summaries, and other research features. AI output should still be independently verified.
Can I listen to earnings calls?
The current web experience supports earnings-call features including live streams, replays, transcripts, summaries, and official documents for supported companies.
Does Google Finance have a mobile app?
An Android app is currently available. Google states that iOS support is coming. Some advanced features remain web-only at the time of this article update.
Can I track cryptocurrency?
The current platform includes crypto as one of its market categories. Availability and supported assets can change.
Can I use Google Finance in Google Sheets?
Yes. The separate GOOGLEFINANCE function can retrieve current and historical securities information into Google Sheets.
Is GOOGLEFINANCE data truly real-time?
Not necessarily. Google’s Sheets documentation says quotes may be delayed by up to 20 minutes and are not sourced from all markets.
Can I use GOOGLEFINANCE for every international stock exchange?
No. Google states that most international exchanges are not supported by the Sheets function.
Can I trade stocks directly through Google Finance?
The service is designed primarily for financial research, market information, and portfolio tracking rather than direct brokerage execution.
Is Google Finance suitable for day trading?
It can provide useful market context, but it should not be assumed to provide the execution tools, guaranteed real-time feeds, order types, or trading infrastructure required by active traders.
Is the financial information investment advice?
No. Google states that its financial information and AI-generated insights do not constitute personalized investment, tax, financial, or legal advice.
Conclusion
Google Finance has developed into a much broader market-research platform than the older version of this article described.
Its current tools include custom watchlists, portfolios, advanced charts, AI-assisted research, earnings information, financial reports, recurring research tasks, market news, and mobile access.
The related GOOGLEFINANCE spreadsheet function also remains useful for people who want to build custom financial spreadsheets using prices, market capitalization, P/E ratios, historical data, and other supported attributes.
However, neither experience should be treated as an infallible market feed or personalized investing system. Data can be delayed, AI can make mistakes, market coverage varies, and important financial decisions should be checked against original sources and official disclosures.
Used carefully, the platform can be a practical starting point for monitoring markets, organizing research, understanding portfolio exposure, and learning more about publicly traded companies.
Continue with our MSN Finance guide, personal finance books, personal finance lab, and financial success strategies.